– January 2025 Scottsdale Homes for Sale and Home Sales –
The Scottsdale single-family home market had a solid start to the year in January.
In this monthly report, we track several sales metrics to keep an eye on our local market.
– Single-family homes for sale – Orange Line – How many homes were for sale at the end of the month.
– Under contract, but accepting backup offers (UCB)* – Gray Line – The number of UCB contracts at the end of the month.
– Pending home sales* – Yellow Line – How many pending sales there were at the end of the month.
– Home Sales – Blue Line – How many homes sold that month.
JANUARY 2025 RESULTS
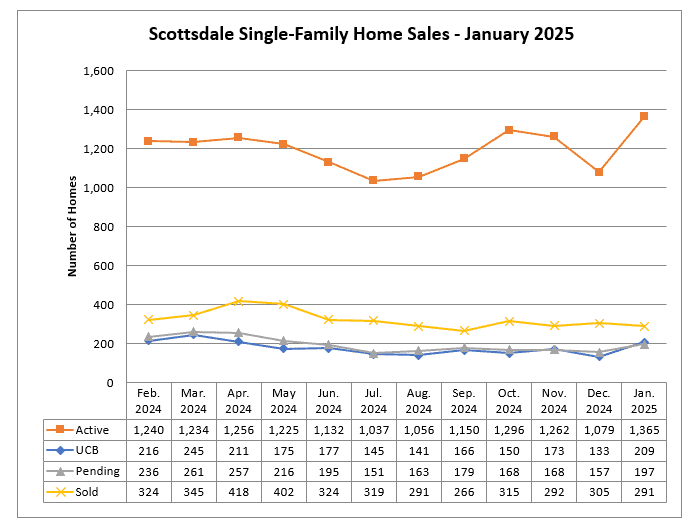
- Scottsdale Homes for Sale: Just as we see inventory dip at the end of the year, the number of homes for sale tends to rebound in January. This January was no different. In fact, this is the highest we have seen it in a very long time. The last time we were above 1,300 homes for sale was April 2020!
- UCB (Under contract, accepting backup offers): After a seasonally slow December, new contract activity was up 36.4% in January
- Pending Homes Sales in Scottsdale: Pending sales also saw a nice increase in January as well. This is promising news for home sales in February.
- Scottsdale Home Sales: Sales in January were down slightly, but turned in a decent performance coming off of the lower number of contracts that had been in the pipeline.
This next section contains two additional monthly sales metrics that we track:
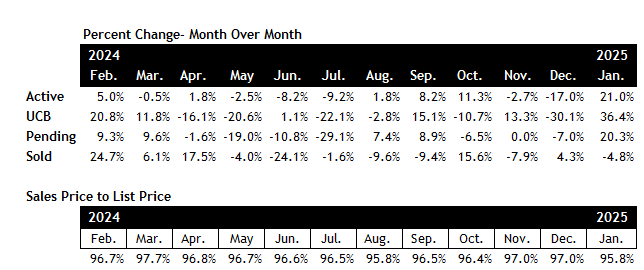
Percent Change Month Over Month – On the top, we are comparing monthly performance to the previous month’s performance. For instance, pendings were up 20.3% in January when compared to December.
Sales Price to List Price – Here we compare the average list price of homes for sale with the average sale price the homes went for. In January, it was 95.8%, which means on average, buyers saw discount of 4.2% off of asking prices.
*Figures for active homes for sale, UCB sales and pending sales are based on the numbers at the end of the month.
Curious about your buying power? Click on the link to learn more.
Search All Scottsdale AZ Homes for Sale
Here are some homes in Scottsdale currently for sale:


 MLS IDX Listing Disclosure © 2025
Copyright 2024 Arizona Regional Multiple Listing Service, Inc. All rights reserved. Information Not Guaranteed and Must Be Confirmed by End User. Site contains live data.
Disclaimer: Data and information were pulled from the Arizona Regional MLS (ARMLS) as of 2/1/2025. Information deemed reliable, but not guaranteed. There may be new home inventory in these figures if the developer is using the MLS to market its homes. This post represents the opinion of the author. No warranties express or implied.
Copyright © 2025 Heather Tawes Nelson | Joyce Tawes


